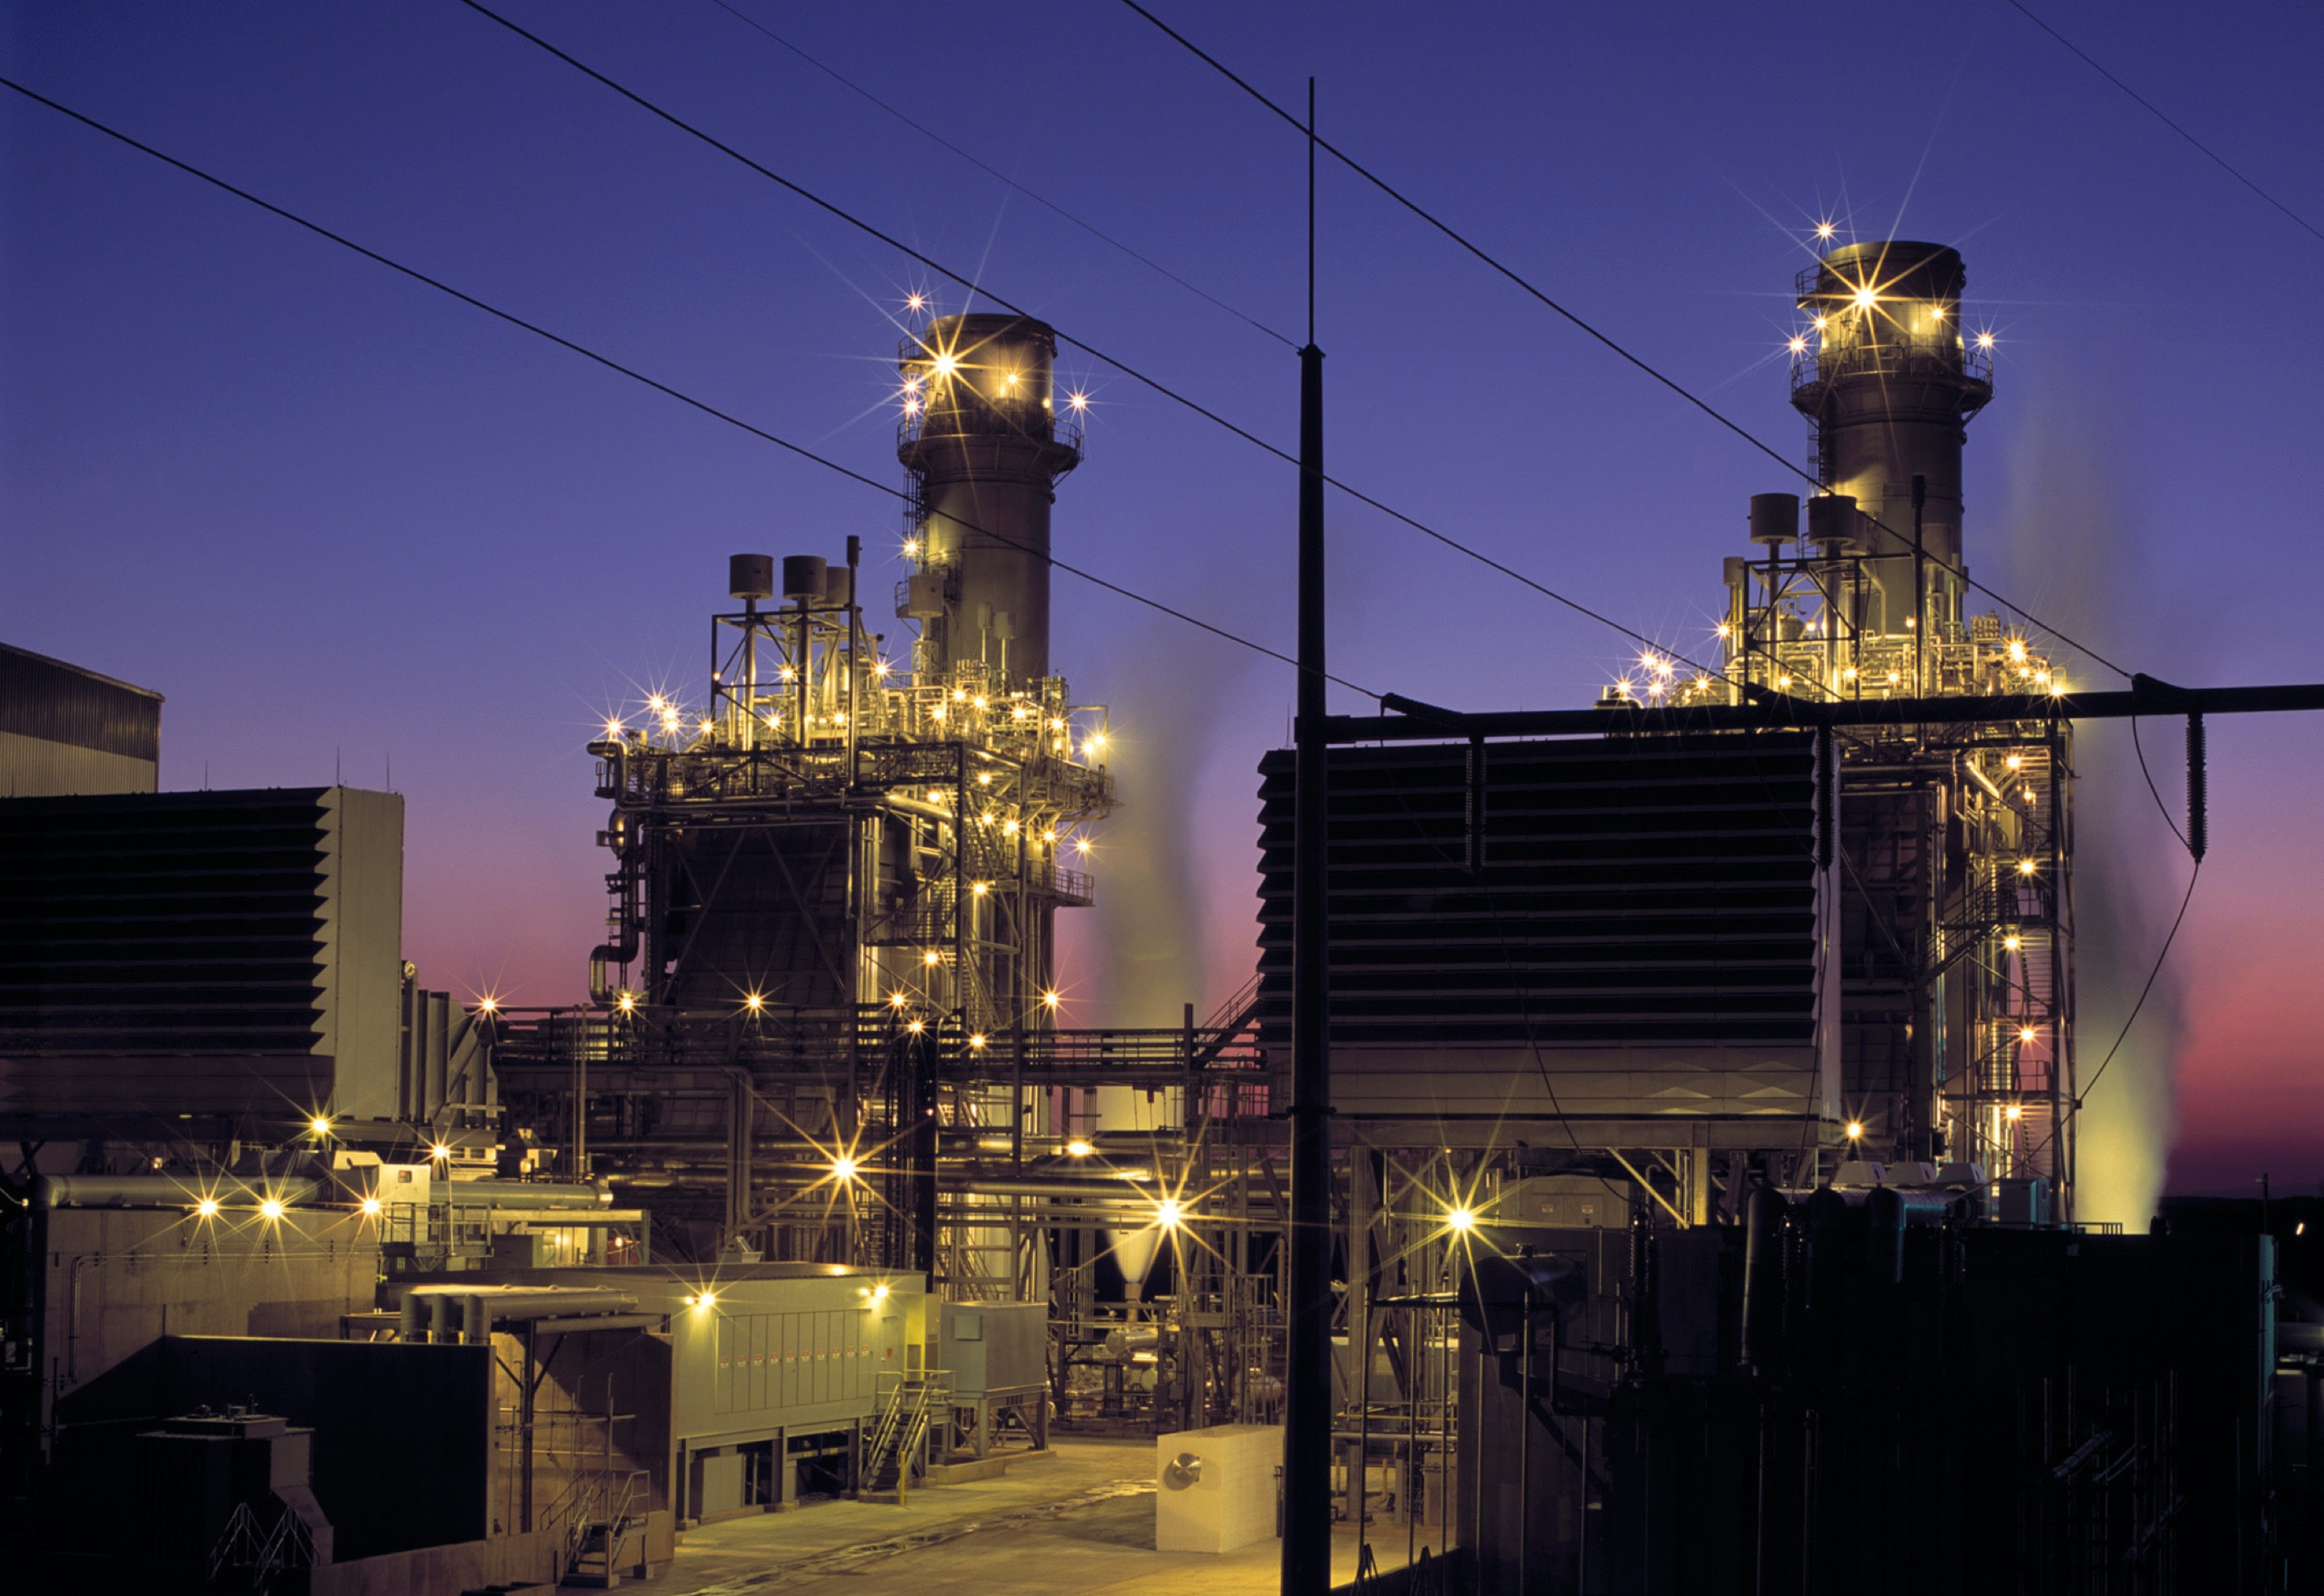
Facility Details
- Highly specialized manufacturing facility with both seasonal and production-based heat loading criteria
- Utilizes large blast ovens in process so usage data can swing drastically
- Looking to minimize costs as well as create savings without committing to a long term contract
Solution
|
Results
| Month | Consumed Volume (m3) 'A' |
Union Gas | Union Gas Total Cost (S) 'A' X' B' | CESi Monthly Volume (m3) 'C' | CESi Gas Cost ($/m3) 'C' / 'E' | CESi Total Costs ($) 'E' | ||
|---|---|---|---|---|---|---|---|---|
| Oct-18 | 161,606 | $0.1514 | $24,470.48 | 173,492 | $0.1418 | $24,604.45 | ||
| Nov-18 | 9,674 | $0.1514 | $1,464.84 | 167,895 | $0.1555 | $26,103.00 | ||
| Dec-18 | 275,401 | $0.1514 | $41,701.51 | 173,492 | $0.1678 | $29,104.35 | ||
| Jan-19 | 297,601 | $0.1804 | $53,685.65 | 173,492 | $0.1590 | $27,586.90 | ||
| Feb-19 | 346,663 | $0.1804 | $62,872.73 | 156,702 | $0.1482 | $23,223.20 | ||
| Mar-19 | 365,158 | $0.1804 | $65,872.73 | 173,492 | $0.1496 | $25,950.00 | ||
| Apr-19 | 177,116 | $0.1712 | $30,328.80 | 167,895 | $0.1447 | $24,288.00 | ||
| May-19 | 149,240 | $0.1712 | $25,255.41 | 173,492 | $0.1422 | $24,671.35 | ||
| Jun-19 | 63,027 | $0.1712 | $10,792.60 | 167,895 | $0.1397 | $23,463.00 | ||
| Jul-19 | 43,093 | $0.1630 | $7,022.36 | 173,492 | $0.1363 | $23,648.35 | ||
| Aug-19 | 29,715 | $0.1630 | $4,842.26 | 173,492 | $0.1362 | $23,631.30 | ||
| Sep-19 | 8,981 | $0.1630 | $1,463.53 | 167,895 | $0.1364 | $22,902.00 | ||
| Balancing | ||||||||
| December-2018 | $9,240.00 | |||||||
| February-2019 | -$25,300.50 | |||||||
| September-2019 | $12,455.55 | |||||||
| Totals | YTD | |||||||
| Total Union Gas Cost | $329,736.47 | |||||||
| Total CESi Cost | $295,570.95 | |||||||
| Difference | -$34,165.52 | |||||||
Breakdown
|
|
|
||||||||||||||||||||||||||||||||||||||||||||||||||||||||||||||||||||||||||||||||||||
Proactive Balancing
|
|
|

REQUEST THE FULL CASE STUDY
We provide proactive solutions for commercial, industrial & agribusiness sectors in a volatile marketplace

